Data Analysis: Regression Formulas
In linear graphing, one skill learned is to find an equation
of a line passing through two given point. There are mathematical techniques which
will find the "best" approximation of a graph that passes through a larger set
of points. These techniques are called Regression formulas. By hand, they are
very tedious. With the calculator, they are a snap.
- To start the procedure, enter some data into the lists as is done in the
plotting points routine go to plotting points
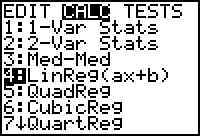
- Press the STAT key, then the Right arrow key to see the screen at the right.
The regression formulas begin at option 4, which is a linear equation, and
continues with quadratic (5), cubic (6) etc. Scrolling down reveals more
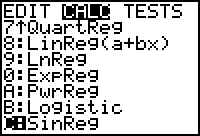 options, most of
which will not be used in college algebra. Select the one you think will give the
best approximation, ie, the one that will touch the most points.
options, most of
which will not be used in college algebra. Select the one you think will give the
best approximation, ie, the one that will touch the most points.
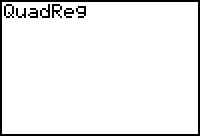
- If we choose (5), this screen appears:
- Enter the x- and y- value list names with a comma between them. The L1
and L2 lists are the default lists.
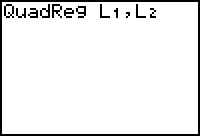 If your data is in these two lists,
just press ENTER.
If your data is in these two lists,
just press ENTER.
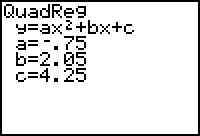
- The next screen reveals the results of the regression calculation. The
calculated approximation is y = -.75x2 +2.05x + 4.25
And here is the data from which the equation was found: 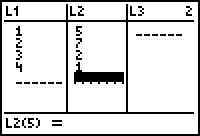
How good a fit is it? Could we do better with a different regression
formula?
To answer these questions, continue to the next data analysis topic, graphing regression equations.