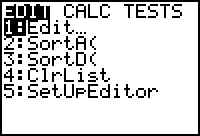
which will be empty if you have never used it.
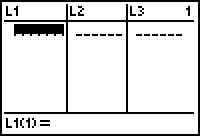
pressing ENTER after each number.
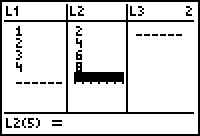 second column (L2),pressing ENTER
after each number
second column (L2),pressing ENTER
after each number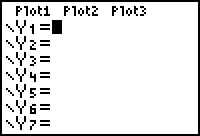
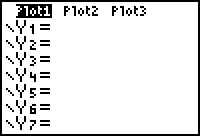
and press ENTER to turn PLOT1 ON.
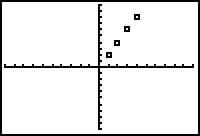 Use ZOOM-9
to automatically find a window that will display all the points.
Use ZOOM-9
to automatically find a window that will display all the points.Helpful Hints:
To clear a column of data, use the arrow-up key to move the cursor over the column title (L1, L2, etc.), Press CLEAR, then the down-arrow. All the entries in the column will be erased when the down-arrow is pressed.
If you get an error message when you press GRAPH, check your WINDOW. The coordinates of all the points must be within the chosen window. For example, if you choose the standard window, neither (5,12) nor (12, 5) could be graphed, and an error message will result.
ALSO, if you are trying to graph an equation later, and the calculator "doesn't work", check the Plots. Usually turning them off cures the problem.