 Ignore all but the line
that reads
Ignore all but the line
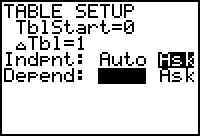
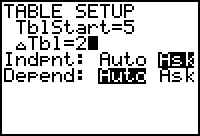
that reads "Indpnt: Auto Ask" Set it to ASK as shown in the window.
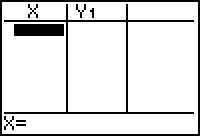 The calculator is waiting for a
value to be keyed in. You may enter a number,Pi, e, or even a formula, which will
show across the bottom.
The calculator is waiting for a
value to be keyed in. You may enter a number,Pi, e, or even a formula, which will
show across the bottom.Decide first whether you want to choose your own x-values or have the calculator build a complete table.
Also, at least ONE equation must be entered in the y= menu screen.
This is a good option if x-values are more-or-less random, with no equal
interval or quite far apart.
Ignore all but the line
that reads The calculator is waiting for a
value to be keyed in. You may enter a number,Pi, e, or even a formula, which will
show across the bottom.Now for automatic table building. This is a good option if the values you need are at equal intervals and close together.
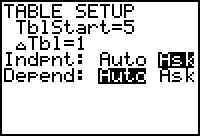
 enter a 2. If
by 50's, enter 50. You may use any value you wish. Let's do 2's. Press 2 and
ENTER.
enter a 2. If
by 50's, enter 50. You may use any value you wish. Let's do 2's. Press 2 and
ENTER. 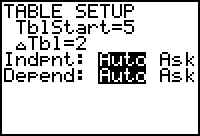 Leave the Depend: set to
AUTO.
Leave the Depend: set to
AUTO.