 and scrolled down to see the rest
 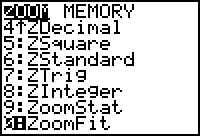 :
:
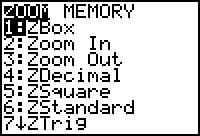
This course uses the following options. We will NOT use options 7 or 8.
Click to see how to use each option..
The center key in the top row is the Zoom menu key.
Pressing it shows this screen:
and scrolled down to see the rest :
This course uses the following options. We will NOT use options 7 or 8.
Click to see how to use each option..


Selecting
the first option, ZBOX, allows the user to enlarge the graph within a specific rectangle.
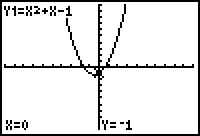
a) Here is a graph in the standard screen: Pressing the TRACE key
shows the equation and the coordinates.
b) When ZBOX is selected a blinking
"+" will show in the graph screen. Move it with the arrow keys so a corner of
the box you will make is where you wish it to be, then press ENTER. 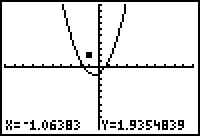
c) Use the arrow keys to trace out the box with the desired graph inside it.
After using the down arrow:
after using the right arrow:
d) When the box is complete, Press ENTER.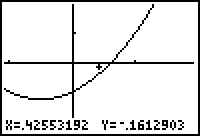
Now the intercept can be seen with more
accuracy. This skill is very handy when analyzing graphs for roots of equations.
back to top of page
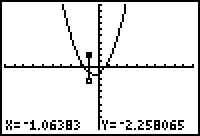
 Press
ZOOM-IN once to get:
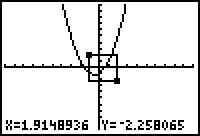
Press
ZOOM-IN once to get: 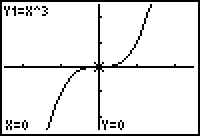
ZOOM-OUT does the opposite of
Zoom IN and works exactly the same way. This is handy if a key point in your graph
is not visible because the window is too small. It is sometimes not so great if you
find you really only wanted to change the scale of one axis and not both.
ZOOM-OUT once to get:
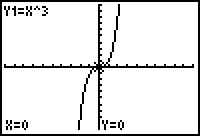
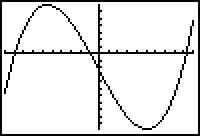
 This cubic graph is
incomplete. First choose ZOOM-OUT, then choose the center of the zoomed in graph.
Here is a good choice:
This cubic graph is
incomplete. First choose ZOOM-OUT, then choose the center of the zoomed in graph.
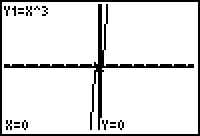
Here is a good choice: 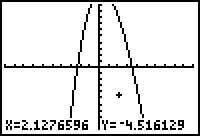 so the new view looks like this:
 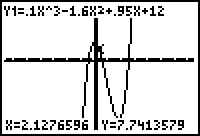 Now all key points can be seen.
back to top of page
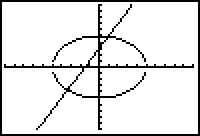
ZSQUARE adjusts the screen to make
the slope of a striaght line and circles closer to scale. The normal screen has
pixels, ie, graph grid squares, that are not square. ZSQUARE fixes that.
Here are a circle and line of slope 2 on the standard screen:
And now after pressing ZOOM-5: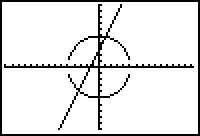
ZSTANDARD
is the most-used option. Whenever you want to graph an equation, and you are not
sure what values are set in the window, press ZOOM-6 and the
equation will graph in the standard window, which is -10 to +10 in both x and y axes.
ZoomStat is a more advanced option and will be taken up in
another section.
ZoomFit can be a helpful tool to find a good window. This routine takes
whatever DOMAIN values (horizontal axis) and adjusts the RANGE values so the graph is on
screen throughout the interval. It is a bit tricky to use, as the Domain must be
just right to get a good result. Sometimes even then, manipulating the Domain and
Range in the WINDOW screen is a better option.
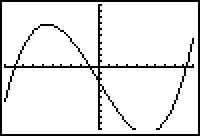
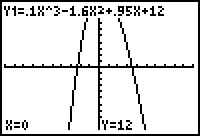
Here is an example: standard screen:
This cubic equation graph has a relative minimum that is off the screen.
And here is the ZOOM-0 screen:
Now the minimum is seen.
Remember, this is a tricky function. The new graph will use whatever x-axis boundaries are set. If you don't like what you see, try changing the x-values in the window.