 The data goes into a list. go to plotting points
If you put data into another list, be sure to press the correct key.
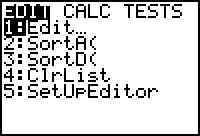
Here is a first look at statistics with the Ti-83. It has remarkable capabilities
not mentioned here. After entering data, the Ti will show the mean, median, and
standard deviation of the data. Here's how:
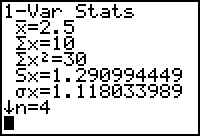
The data goes into a list. go to plotting points| The mean | |
| Sum of the entries | |
| Sum of squares of entries | |
| Standard deviation of a sample | |
| Standard deviation of the whole (Use this one most of the time) | |
| Number of items in data Use the down-arrow to see more | |
Smallest item in data 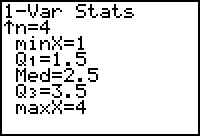 | |
| Value at the 1st quarter | |
| Median of the data | |
| Value at the 3rd quarter | |
| Largest value in data |