Operations: Graphing Inequalities
Shading above or below a graph can be done by accessing
the Y= menu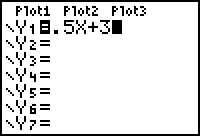
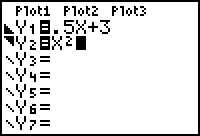
- Press Y= and enter the desired function. For example:
- Use the left-arrow key to move the cursor to the far left.
- Press the enter key twice.
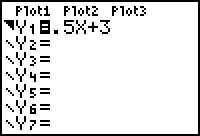 The triangle is blinking.
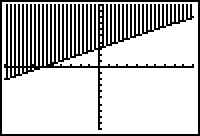
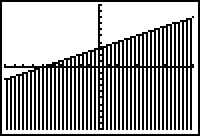
- Press Graph to see it. This is the GREATER THAN option. The
graph should look like this:
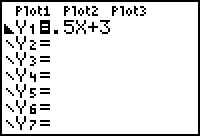
- Go back to the Y= screen and press ENTER again. This is the LESS THAN
option.
- Graph inequality SYSTEMS the same way
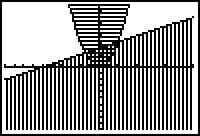 Notice that the calculator changes the shading so
that the solution to the system is visible.
Notice that the calculator changes the shading so
that the solution to the system is visible.
HINT: The graph cannot distinguish between "less
than" and "less than or equal to" graphs. The same for "greater
than" and "greater than or equal to" graphs.