Operations: Graphing a Piecewise Function
It is possible to
graph a function over a specific interval within the chosen window.
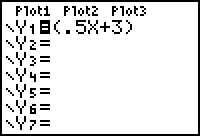
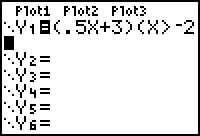
- Press Y= and enter the desired function in parentheses.
For example:
- Press the ( button again.
- Press the "x,T,0,n" key
- Press 2nd-MATH, (TEST)
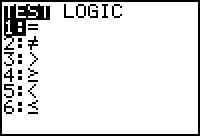
- Choose an inequality. Try > for this example by pressing 3.
- Enter the value that is the end point of the interval, say -4 and close the
parentheses.
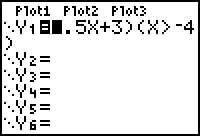
- Graph in a standard window:
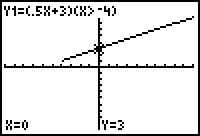 It may be easier to see the graph in DOT MODE.
If the given domain is, for another example, - 2 < x <
7, follow these steps.
- Follow steps 1-5 above to see this:
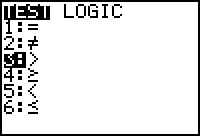
- Press 2nd-MATH
- Use the right arrow key to highlight LOGIC
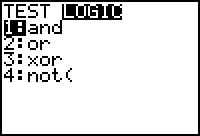
- Because this is a "between" inequality, choose AND by pressing
1.
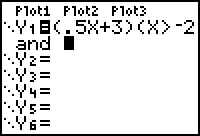
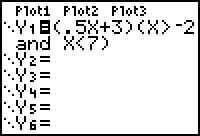
- Now enter the rest of the inequality,
the x < 7 part:
- Close the parentheses
- Press GRAPH
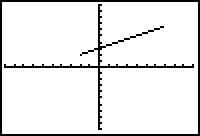
This graph was made in DOT MODE.
HINT: To do a domain with x< -4 , x > 6 use
OR instead of AND.